What Is Graph Engineering? How Today's AI Teams Up to Get Real Work Done
A friendly, jargon-free guide to graph engineering, the 2026 idea of building AI as a map of connected steps instead of one big loop. See how today's AI agents work, why small mistakes add up, and how checkers, branches and teamwork fix it.

On this page
Imagine asking one very smart person to plan a wedding by themselves: the venue, the food, the music, the invitations, the budget, all of it, with nobody to check their work. They might pull it off. But somewhere around task number 37, something will probably slip.
Now imagine a wedding planning team. One person handles the venue, another the food, another the guest list. A coordinator decides who does what next, and someone double-checks the budget before any money is spent. Same smart people, much better odds.
That second picture is the big idea behind graph engineering, one of the newest buzzwords in AI. It's how the people who build AI products are starting to organize AI so it can handle long, real-world jobs instead of just answering one question at a time. This article explains what it is in plain language, with plenty of pictures.
Zooming out: prompt, context, graph
Over the last few years, the way people get good results from AI has kept "zooming out":
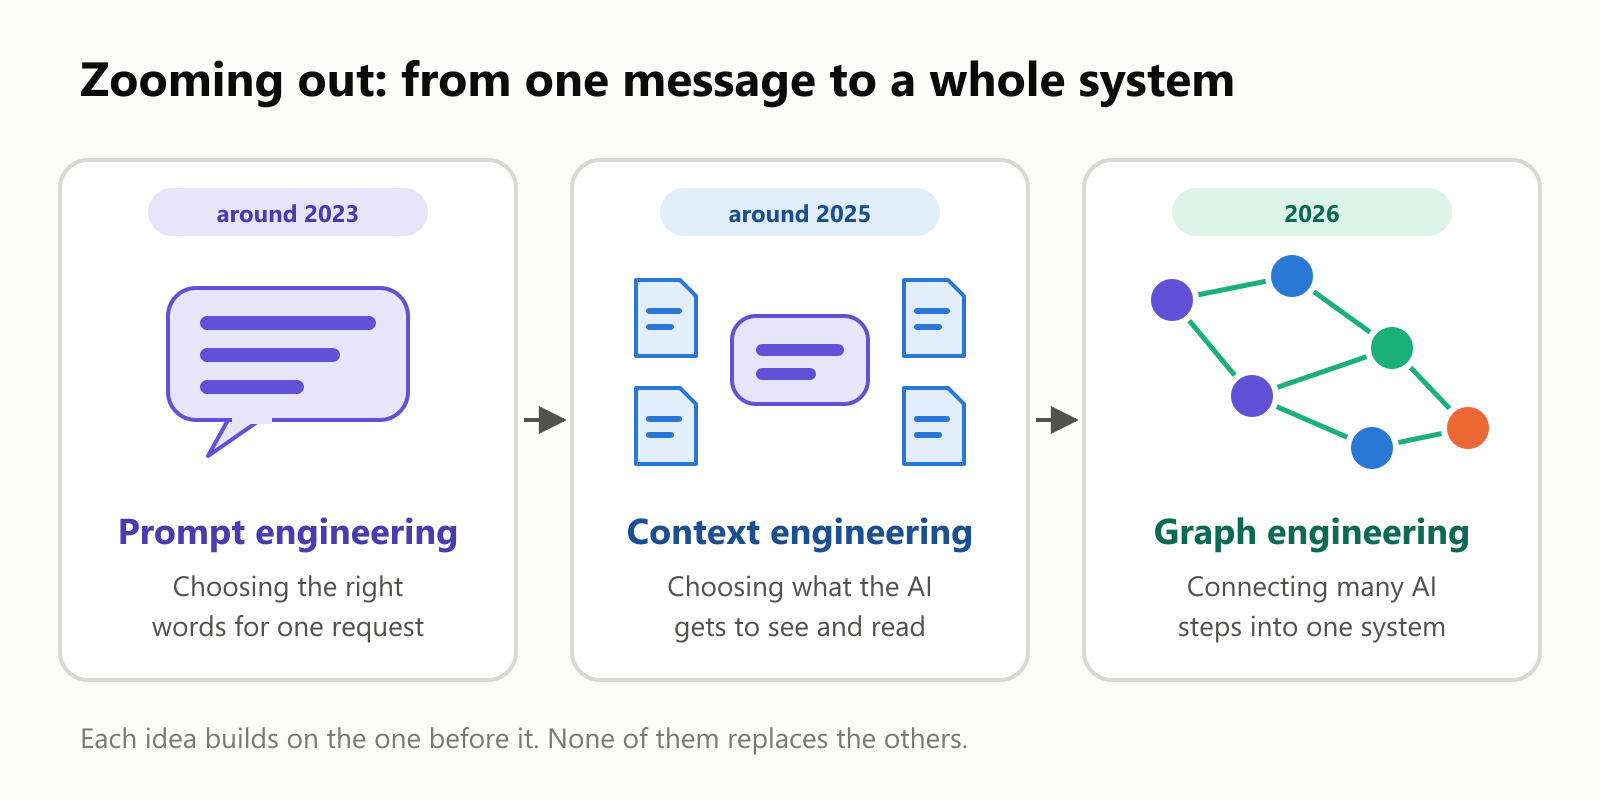
- Prompt engineering is about the words: how you phrase a single request.
- Context engineering is about the information: which documents, notes and tool results the AI gets to read before it answers.
- Graph engineering is about the whole system: how many AI steps, tools and people connect to each other to finish a big job.
None of these replaces the others. A good graph is still made of steps with good prompts and good context. Graph engineering just adds the big-picture plan.
Wait, what's a "graph"?
When most people hear "graph", they think of a bar chart. In computing, a graph means something else: dots connected by lines. A subway map is a graph. So is a family tree, and so is a flowchart.
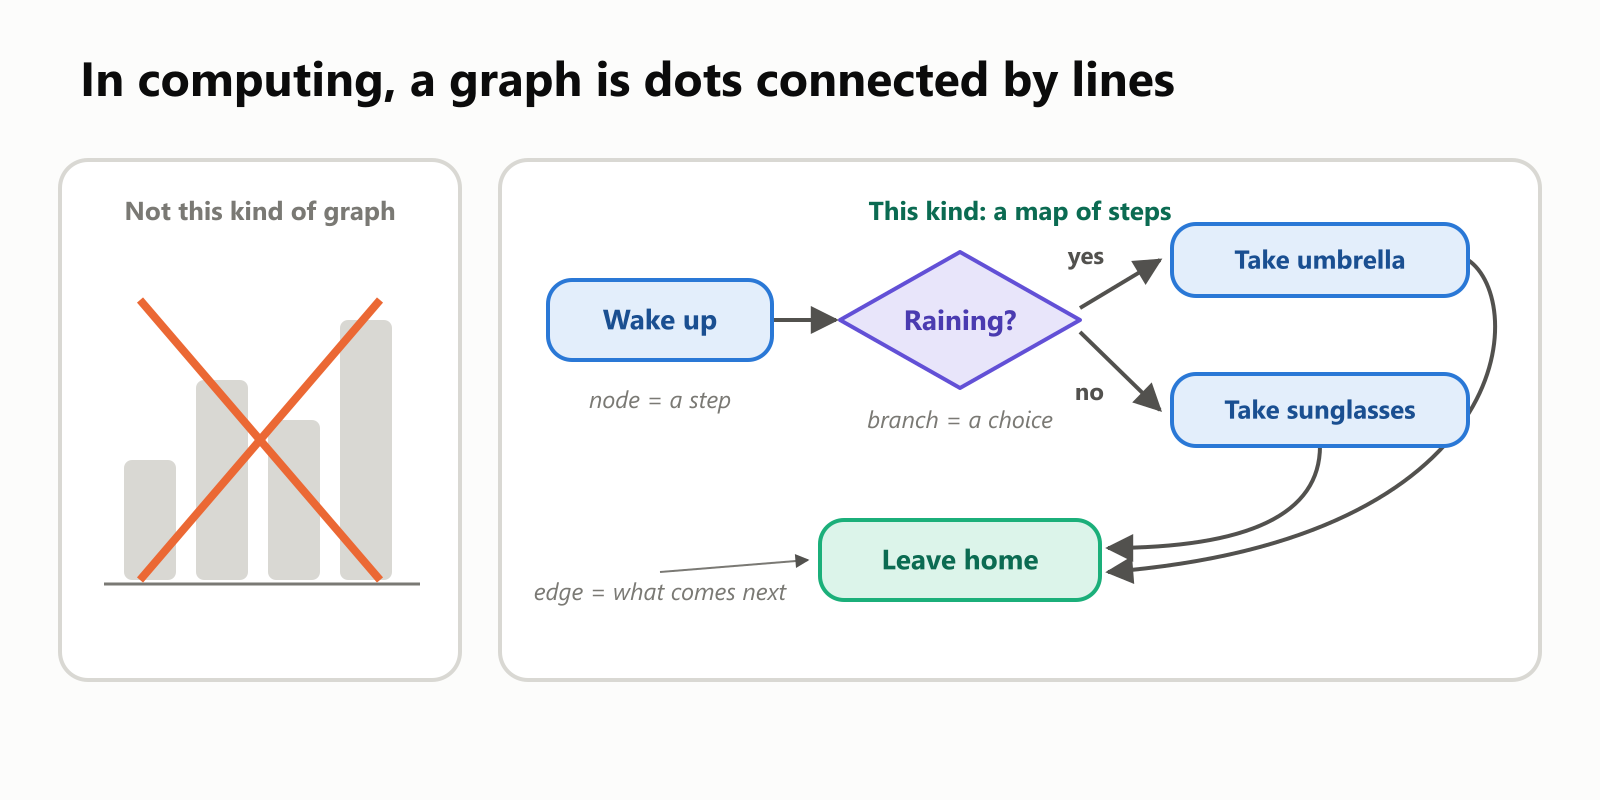
Graphs have just two ingredients:
- Nodes (the dots): each one is a step, like "Wake up" or "Take umbrella".
- Edges (the lines): each one says what happens next. Some steps have more than one way out, depending on a choice. That's called a branch.
That's it. If you've ever drawn a flowchart on a whiteboard, you've already done a little graph engineering.
How AI agents work today: one big loop
To see why graphs matter, let's look at how most AI agents work right now. An agent is an AI that doesn't just chat; it takes actions to reach a goal, like searching the web, filling in a form or booking a table. (It takes those actions through tools, which you might have read about in the MCP article.)
Under the hood, a typical agent is surprisingly simple. It's an LLM running in a loop:
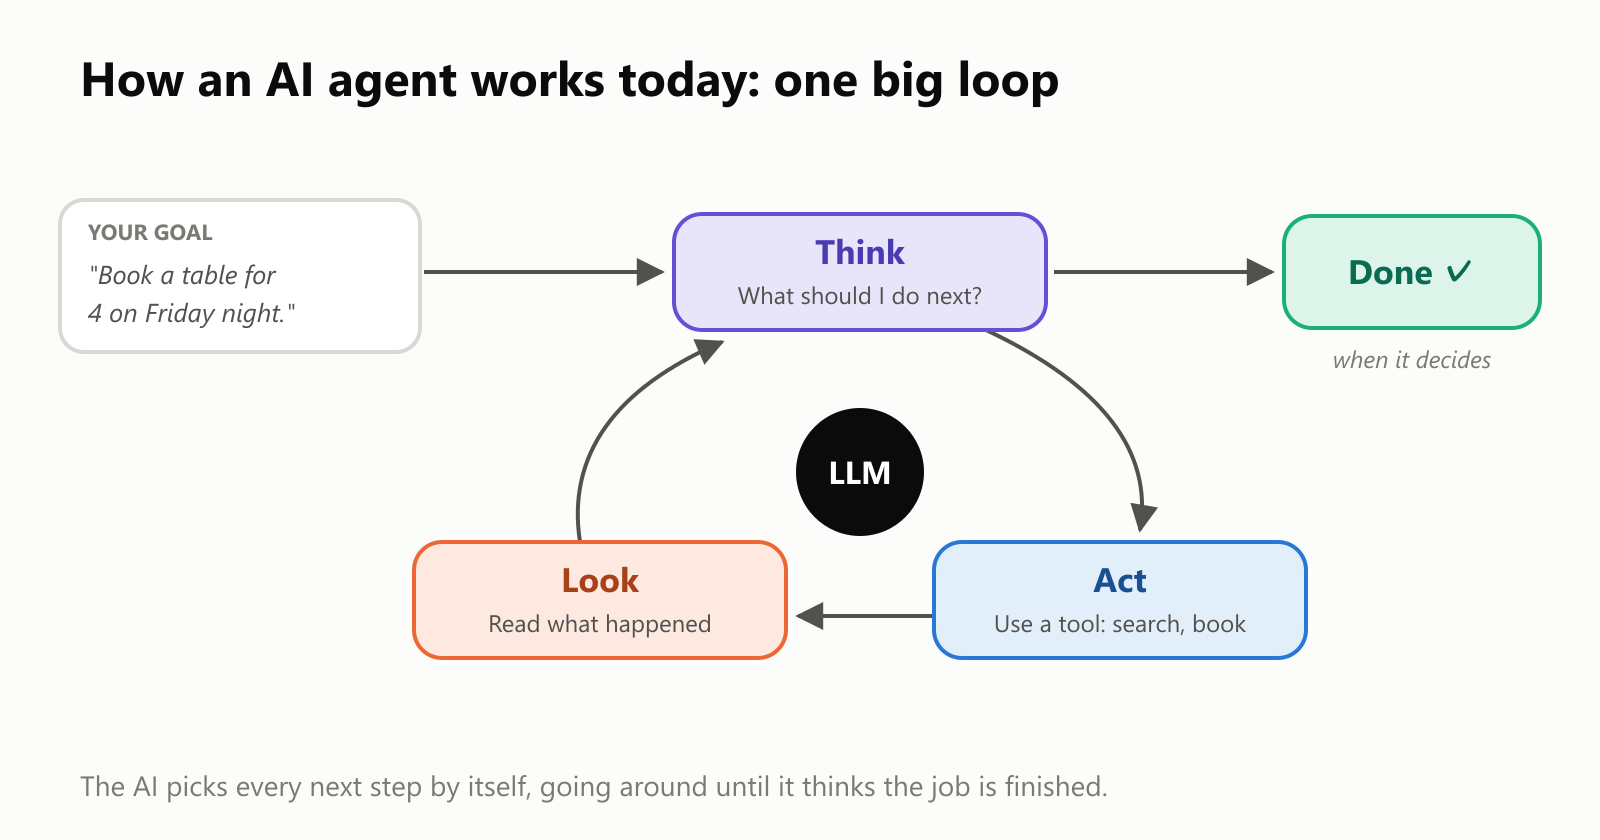
- Think: "What should I do next?"
- Act: use a tool, like searching for restaurants.
- Look: read the result.
- Go back to step 1, until the AI decides the job is done.
This loop is genuinely powerful. It's how AI coding assistants fix bugs and how "deep research" features read dozens of web pages before writing a report. But notice something: the AI decides every single next step by itself, with nobody steering. For short jobs, that's fine. For long jobs, it becomes a problem.
The problem: small mistakes add up
Say an AI gets each step right 95% of the time. That sounds great, like an A grade. But a long job needs many steps to go right, one after another. If any step goes wrong and nothing catches it, the whole job goes wrong.
Here's what happens to the odds of finishing a job correctly as the number of steps grows:
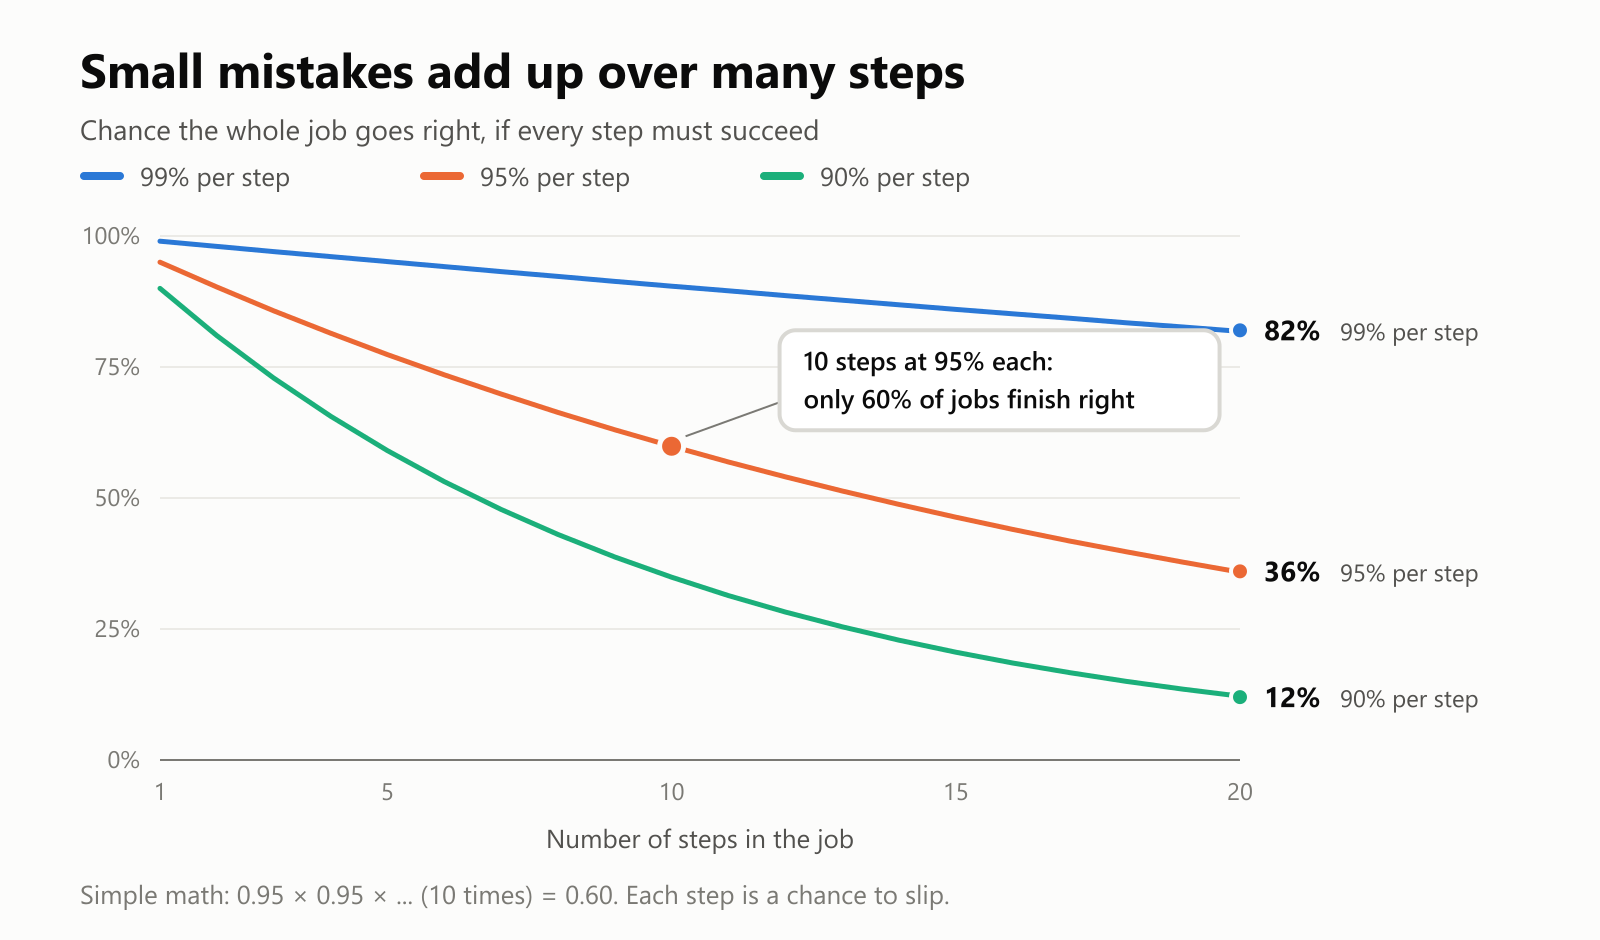
This is just multiplication. Ten steps at 95% each is 0.95 × 0.95 × 0.95… ten times, which comes out to about 0.60. So a "95% reliable" AI finishes a 10-step job correctly only about 6 times out of 10. At 20 steps, it's down to about 1 in 3.
| Steps in the job | 99% per step | 95% per step | 90% per step |
|---|---|---|---|
| 1 | 99% | 95% | 90% |
| 5 | 95% | 77% | 59% |
| 10 | 90% | 60% | 35% |
| 20 | 82% | 36% | 12% |
There's a second problem too. Inside one big loop, it's hard to see where things went wrong, hard to promise the AI will always follow your company's rules, and hard to step in at the right moment. It's a bit like a black box that sometimes surprises you.
Graph engineering: draw the map first
Graph engineering is the practice of designing an AI system as a map of connected steps instead of one open-ended loop. The builder draws the map: which steps exist, what each step is responsible for, where the choices are, where work gets checked and where a person needs to approve something. The AI still does the clever work inside each step, but it no longer has to figure out the whole journey on its own.
Here's an example: a graph that answers customer emails for an online shop.
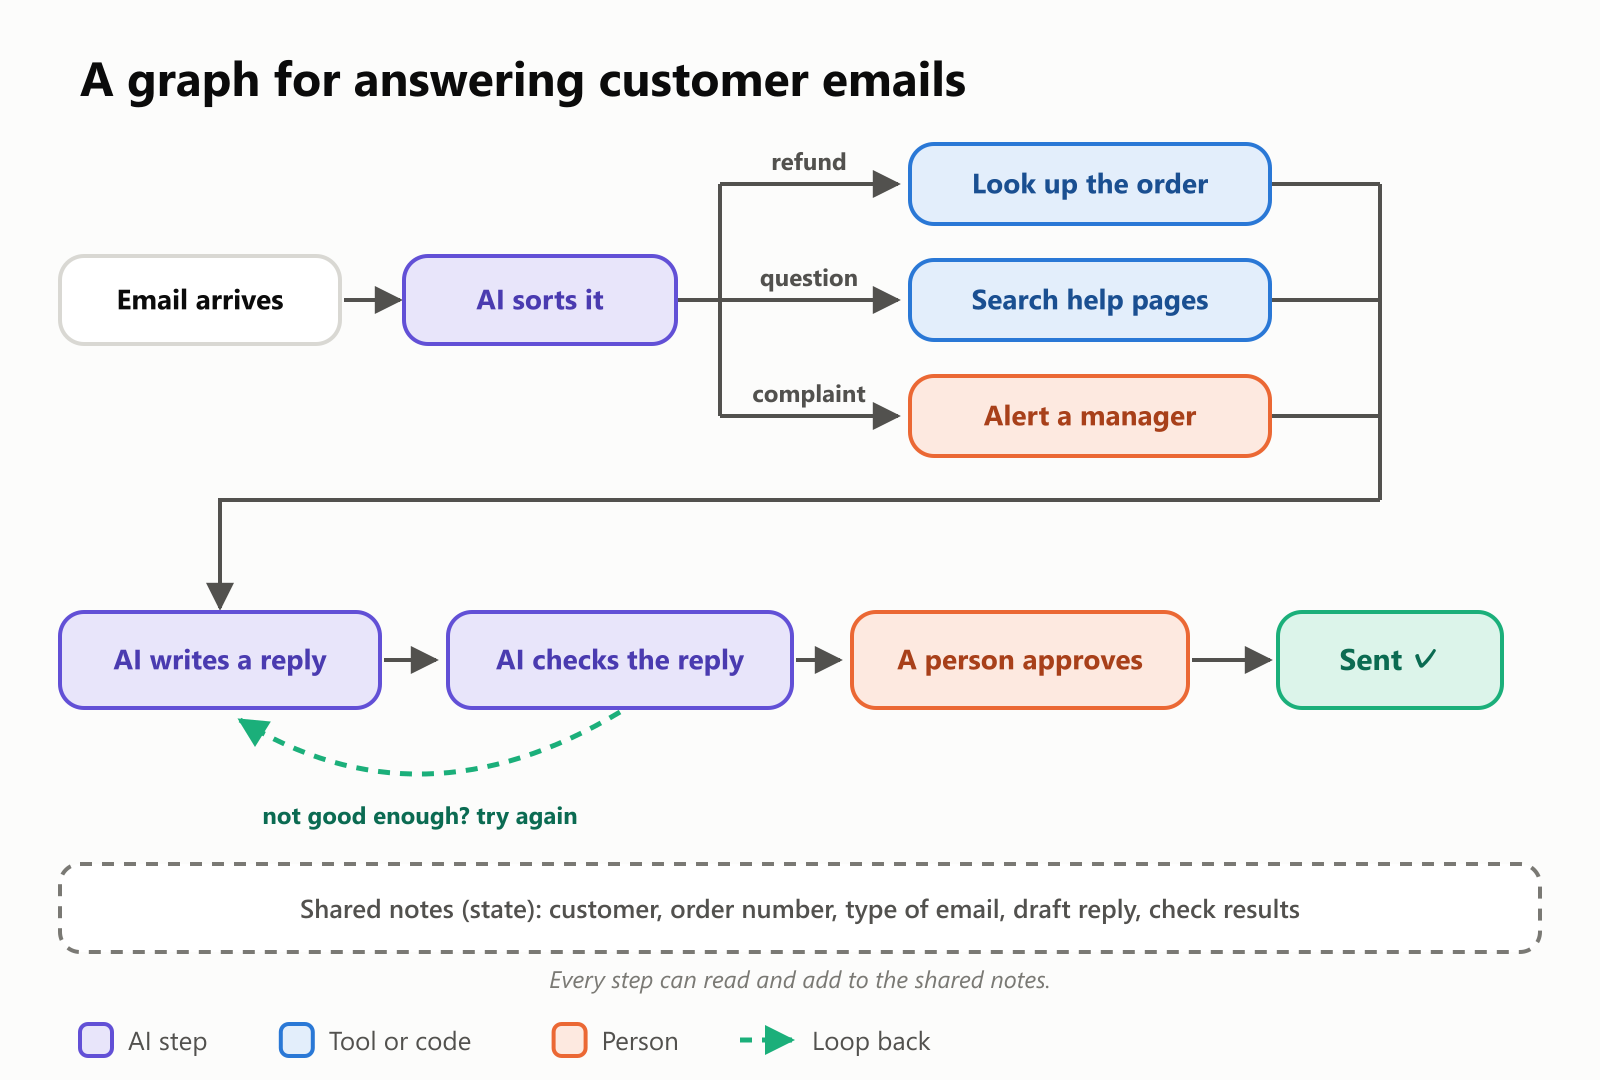
Look at what the map gives you:
- Small, focused steps. Each AI step has one clear job ("sort this email", "write a reply"), which is much easier to get right than "handle customer service".
- Branches. Different kinds of emails take different paths. A refund needs the order details; a question needs the help pages.
- A checker with a loop back. A second AI step reviews the draft. If it's not good enough, the work goes back to be redone.
- A person in the loop. Before anything is sent, a human approves it. The graph guarantees that step can never be skipped.
- Shared notes. Every step reads and adds to the same set of notes (builders call this state), so nothing gets lost between steps.
- Regular code where it fits. Looking up an order doesn't need AI at all. A plain, predictable program does it, every time.
Why the checker matters so much
Remember the 95% problem? Watch what happens when each step gets checked and retried:
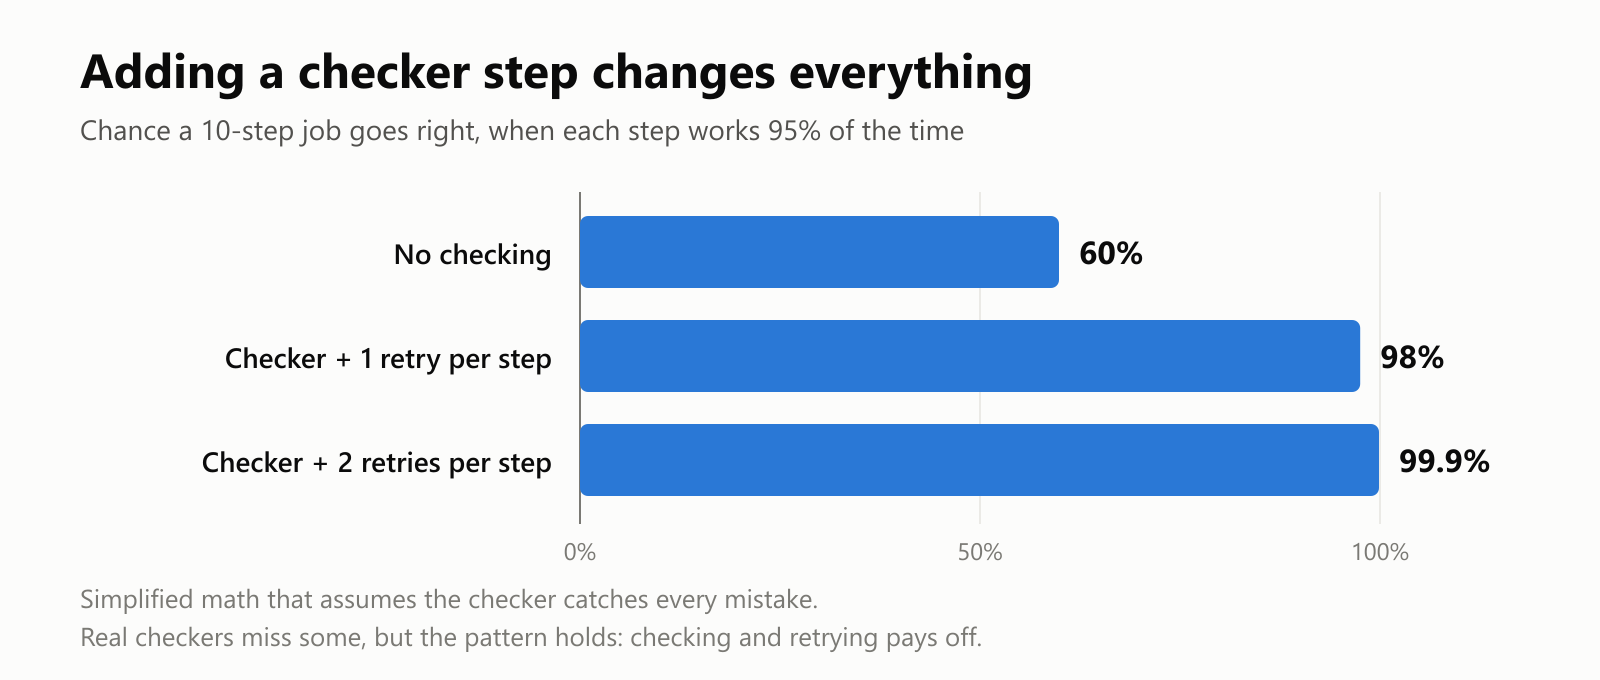
With a checker that catches mistakes and one retry, a step fails only if both tries go wrong: 5% of 5%, or 0.25%. Across 10 steps, the job goes right about 98% of the time instead of 60%.
Real checkers aren't perfect, so real numbers are lower than this. But the lesson holds, and it's the heart of graph engineering: you don't need a perfect AI if you design a system that catches its mistakes.
Teamwork: several AIs at once
Graphs also let you split work between several AI helpers, often called agents or subagents, and run them at the same time when the steps don't depend on each other.
Say you ask an AI to plan a trip. Finding flights, hotels and restaurants are separate searches. Why wait for one to finish before starting the next?
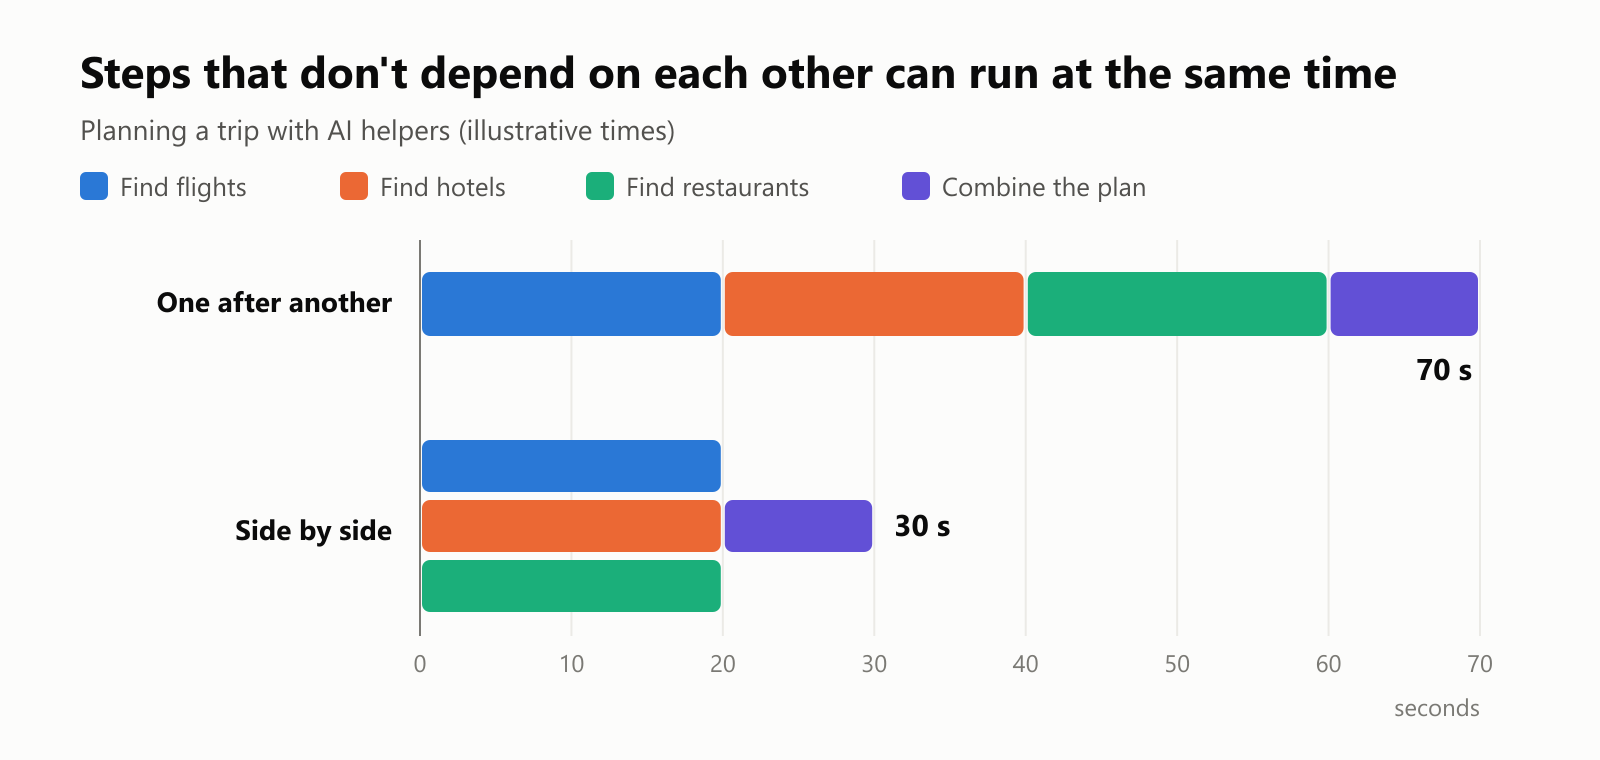
This is how several AI research tools work. For example, Anthropic has described how Claude's Research feature uses a lead agent that splits a question into parts and hands them to helper agents, which search in parallel and report back. A graph is the natural way to draw that: one node fans out into several, then they join back together.
Each helper also gets its own fresh, focused context ("you only care about hotels"), which tends to produce better work than one AI juggling everything.
The other kind of graph: connected facts
You may also hear "graph" in AI in a second sense: a knowledge graph. Instead of steps, the dots are facts about things, and the lines are how they relate.
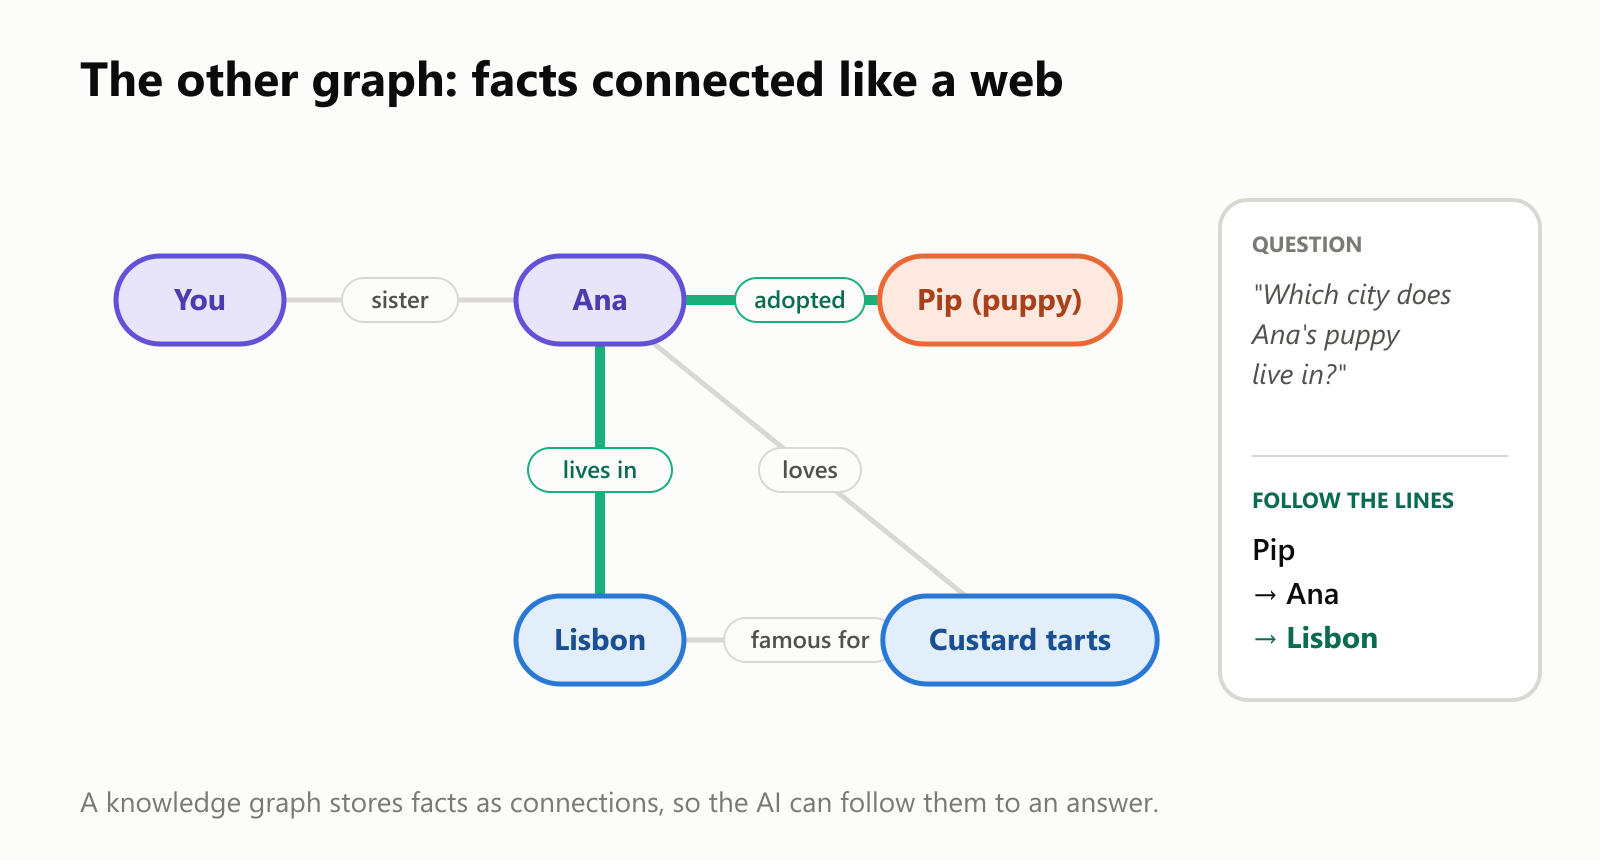
When facts are stored this way, an AI can follow the lines to answer questions that no single document answers directly. "Which city does Ana's puppy live in?" isn't written anywhere, but Pip → Ana → Lisbon gets you there. Some AI systems use knowledge graphs as a kind of long-term memory, and a technique called GraphRAG uses them to help an AI find related information before it answers.
Most people who say "graph engineering" in 2026 mean the first kind (maps of steps), but the two often show up together: a step in the graph might look something up in a knowledge graph.
One loop or a graph?
Graphs aren't always better. They're more work to design, and for many tasks a single AI loop is simpler and plenty good.
| One big agent loop | A graph of steps | |
|---|---|---|
| Best for | Open-ended, exploratory tasks | Repeated jobs that must be reliable |
| Who plans the steps | The AI, as it goes | The builder, ahead of time |
| Predictability | Can surprise you | Follows the map every time |
| Finding mistakes | Hard: it's all one long story | Easier: check step by step |
| Human approvals | Easy to forget | Built into the map |
| Effort to build | Low | Higher |
A good rule of thumb: let the AI figure things out when you're exploring, and draw a graph when a job has to go right every time, like handling payments, medical paperwork or customer emails.
Where you'll run into this
You might never draw an AI graph yourself, but you'll increasingly use products built from them:
- Research assistants that split a question, read many sources in parallel and combine the results.
- Coding assistants that plan a change, write code, run tests, and loop back when tests fail.
- Customer support systems that sort messages, look things up and hand tricky cases to a person.
- Business automations that read invoices or forms, check them, and ask a human before anything final happens.
Builders often use tools made for this, such as LangGraph, which lets them describe an AI system literally as nodes and edges.
A small glossary
- Graph: dots (nodes) connected by lines (edges). Not a bar chart!
- Node: one step in the graph, done by an AI, a regular program or a person.
- Edge: a connection that says what happens next.
- Branch: a point where the path splits depending on a choice.
- AI agent: an AI that takes actions with tools to reach a goal.
- Agent loop: the think → act → look cycle most agents run on.
- State: the shared notes every step can read and add to.
- Checker: a step that reviews another step's work and can send it back.
- Human in the loop: a step where a person reviews or approves before the system continues.
- Knowledge graph: facts stored as connected things, which an AI can follow to find answers.
- Graph engineering: designing an AI system as a map of connected steps, checks and people.
Wrapping up
Today's AI agents are impressive, but on their own they work like one brilliant person doing a long job with nobody checking. Small mistakes add up, and a 95% step turns into a 60% job surprisingly fast.
Graph engineering is the fix that builders are reaching for: draw a map of small, focused steps, add branches for different situations, put checkers and retries where mistakes are likely, run independent work side by side, and keep a person in charge of the decisions that matter. The AI is still the star inside each step. The graph just makes sure the whole show goes right.
Next time an AI product researches a topic for minutes, double-checks itself, or stops to ask for your approval, there's a good chance a graph is quietly running behind the scenes.
Read next
What Is Reinforcement Learning? How AI Learns by Trial, Error and Reward
A friendly, jargon-free introduction to reinforcement learning, how AI learns by trial, error and reward, like training a dog with treats. Watch a real robot learn a maze, see why exploring matters, and learn how it shapes chatbots.
 nbkhope
What Is Loop Engineering? How AI Agents Keep Working Until the Job Is Done
A friendly, jargon-free guide to loop engineering, the 2026 idea of designing the loop that lets an AI agent keep working until a job is done, with clear goals, real feedback, smart stop rules and knowing when to ask a person.
nbkhope
What Is Prompt Engineering? How to Ask AI for Exactly What You Need
A friendly, jargon-free guide to prompt engineering, the skill of asking AI chatbots like ChatGPT, Claude and Gemini for exactly what you need. Learn what a prompt is, what makes a good one, and simple techniques anyone can use.
nbkhope
Comments
Be kind and specific. Comments with links from new accounts appear after a moderator reviews them.